Introduction
Providence is an open-source session replay tool for single-page applications that uncovers insights from user interactions. By incorporating AI analysis of session data and an RAG chatbot for contextual exploration, Providence helps product designers understand and improve user experiences.
This document is a deep dive into the benefits of session replay, the fact that gaining these benefits is time-consuming, how Providence alleviates that challenge, and how it was built including several programming challenges.
Observability: Metrics For Applications
Session replay tools are part of the broader category of application observability software. Applications are complex. With numerous interconnected components, things go wrong in many different ways. Slow response times and errors are just two ways the user experience can be impacted.
Observability focuses on gathering and analyzing data to understand an application’s internal state. These tools reduce reliance on manual troubleshooting methods, such as combing through logs or waiting for users to report issues. An application becomes observable when it is instrumented. Instrumenting an application is to incorporate code that will capture and emit the desired metrics.
In backend systems, telemetry metrics are the foundation of observability. Telemetry refers to quantitative measurements emitted from an application to monitor behavior, performance, and health. Telemetry data can include request/response times, error rates, and metrics that trace data and requests through a system. By automatically collecting and analyzing these metrics, friction points and technical issues can be proactively identified minimizing user effects.1
Session Replay: Frontend Observability
Session replay provides a powerful complement to the backend telemetry data by observing the frontend behavior of an application. Watching an application in use is a direct approach to understanding what actions lead to user confusion or errors. With session replay, developers and product designers can watch a reconstruction of the DOM states, simulated as a video of the application in use.
The product designer can then see what the user sees as they interact with an application. The video-like replay will show changes in the DOM, mouse actions, and scrolls. Often network requests and error notifications are added to session data to build a more complete picture of the user experience. (See using rrweb for details on how session replay works.)
Benefits of Session Replay
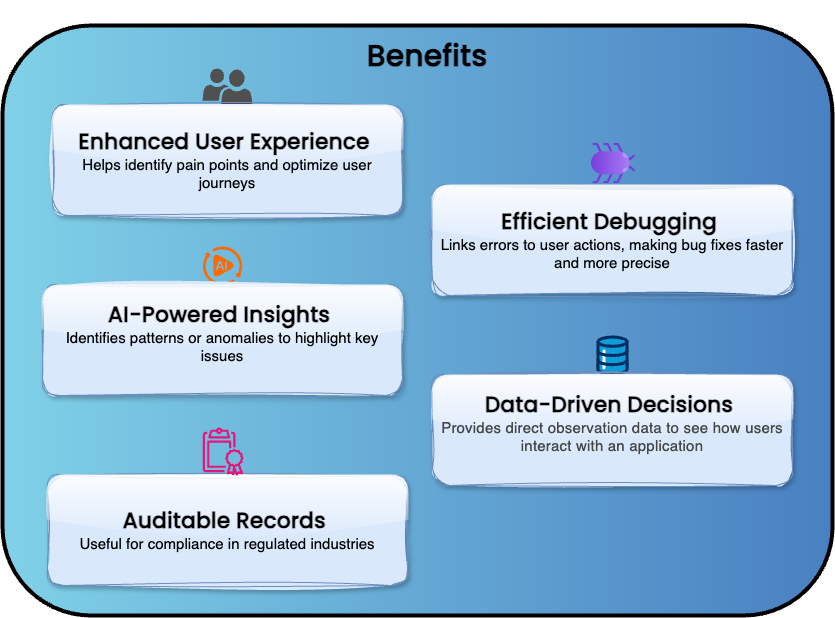
Common use cases for session replay include improving user experience, diagnosing bugs, optimizing user conversions, and providing an auditable record for compliance in certain industries. By linking error occurrences to session data, developers can see the user actions that led to an error, making debugging faster and more accurate. AI-powered insights can enhance this by identifying common patterns or anomalies across sessions. Many of today’s popular session replay tools have powerful debugging features.
Direct observation of a product in use, allows teams to see both successful interactions and friction points. Without session replay, someone looking to understand how the application is being used could use surveys or have conversations with their customers. Valuable feedback can be gained through this method but it relies on customers remembering what they did, describing it accurately, and responding to the survey in the first place. While submitted complaints from users might surface glaring issues, feedback for smoothly functioning areas is less common. Session replay can enable data-driven product decisions.

Challenges of Traditional Session Replay
Despite its benefits, companies report not utilizing session replay. In the end, watching a replay mostly consists of watching mouse moves and scrolls, which is monotonous and time-consuming. Replayers typically build in up to 8x speed to accelerate watching a session. Additionally, some solutions incorporate flagging errors to jump straight to a specific moment in a replay just before an error occurs. Even so, Microsoft Clarity, an existing session replay product with AI integration writes: ‘While session replays add incredible arsenal to an experimenter’s toolkit, they do have a drawback: they’re extremely time-consuming to take in.’2 Similarly, at Session Stack AI, potential customers reported, ‘We don’t really want to invest in session replay because we don’t have time to watch the replays.’3 We built Providence to gain insights from session data while minimizing the need to watch the replays.
Providence vs. Existing Session Replay Tools
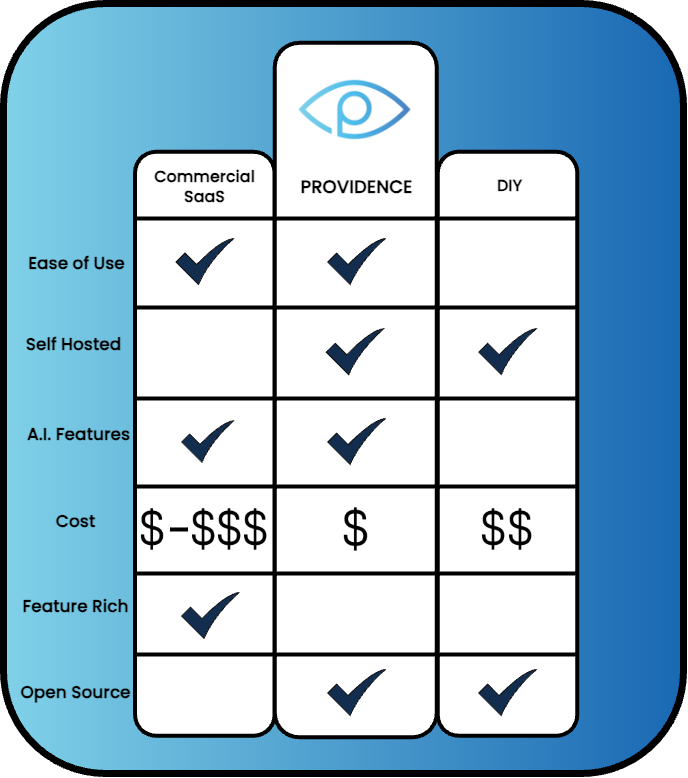
To begin using session replay, there are two primary approaches, you could use an existing SaaS product or build your own using the rrweb library.
There are many existing session replay solutions on the market today. FullStory and LogRocket offer session replay bundled with backend telemetry tools. This might be a good option if you are looking to incorporate telemetry metrics or your goals are specifically to aid in debugging. Microsoft Clarity provides session replay along with basic AI analysis. A trade-off of using these companies is that your data is stored on the third party’s databases. When an application is instrumented with Clarity, Microsoft has access to the session data which it stores on the Microsoft Azure cloud service for 30 days.4 The cost of these tools ranges from free to a monthly fee based on usage.
Alternatively, to self-host session data, you could use the rrweb library to build your own capture and replay application. While this is an option, configuring and building custom tooling can take up significant engineering resources. In contrast, Providence is a self-hosted, open-source session replay tool. Providence offers fewer debugging features while focusing on providing descriptions of how users interact with an instrumented application.

